
Water Year 2026 Updates
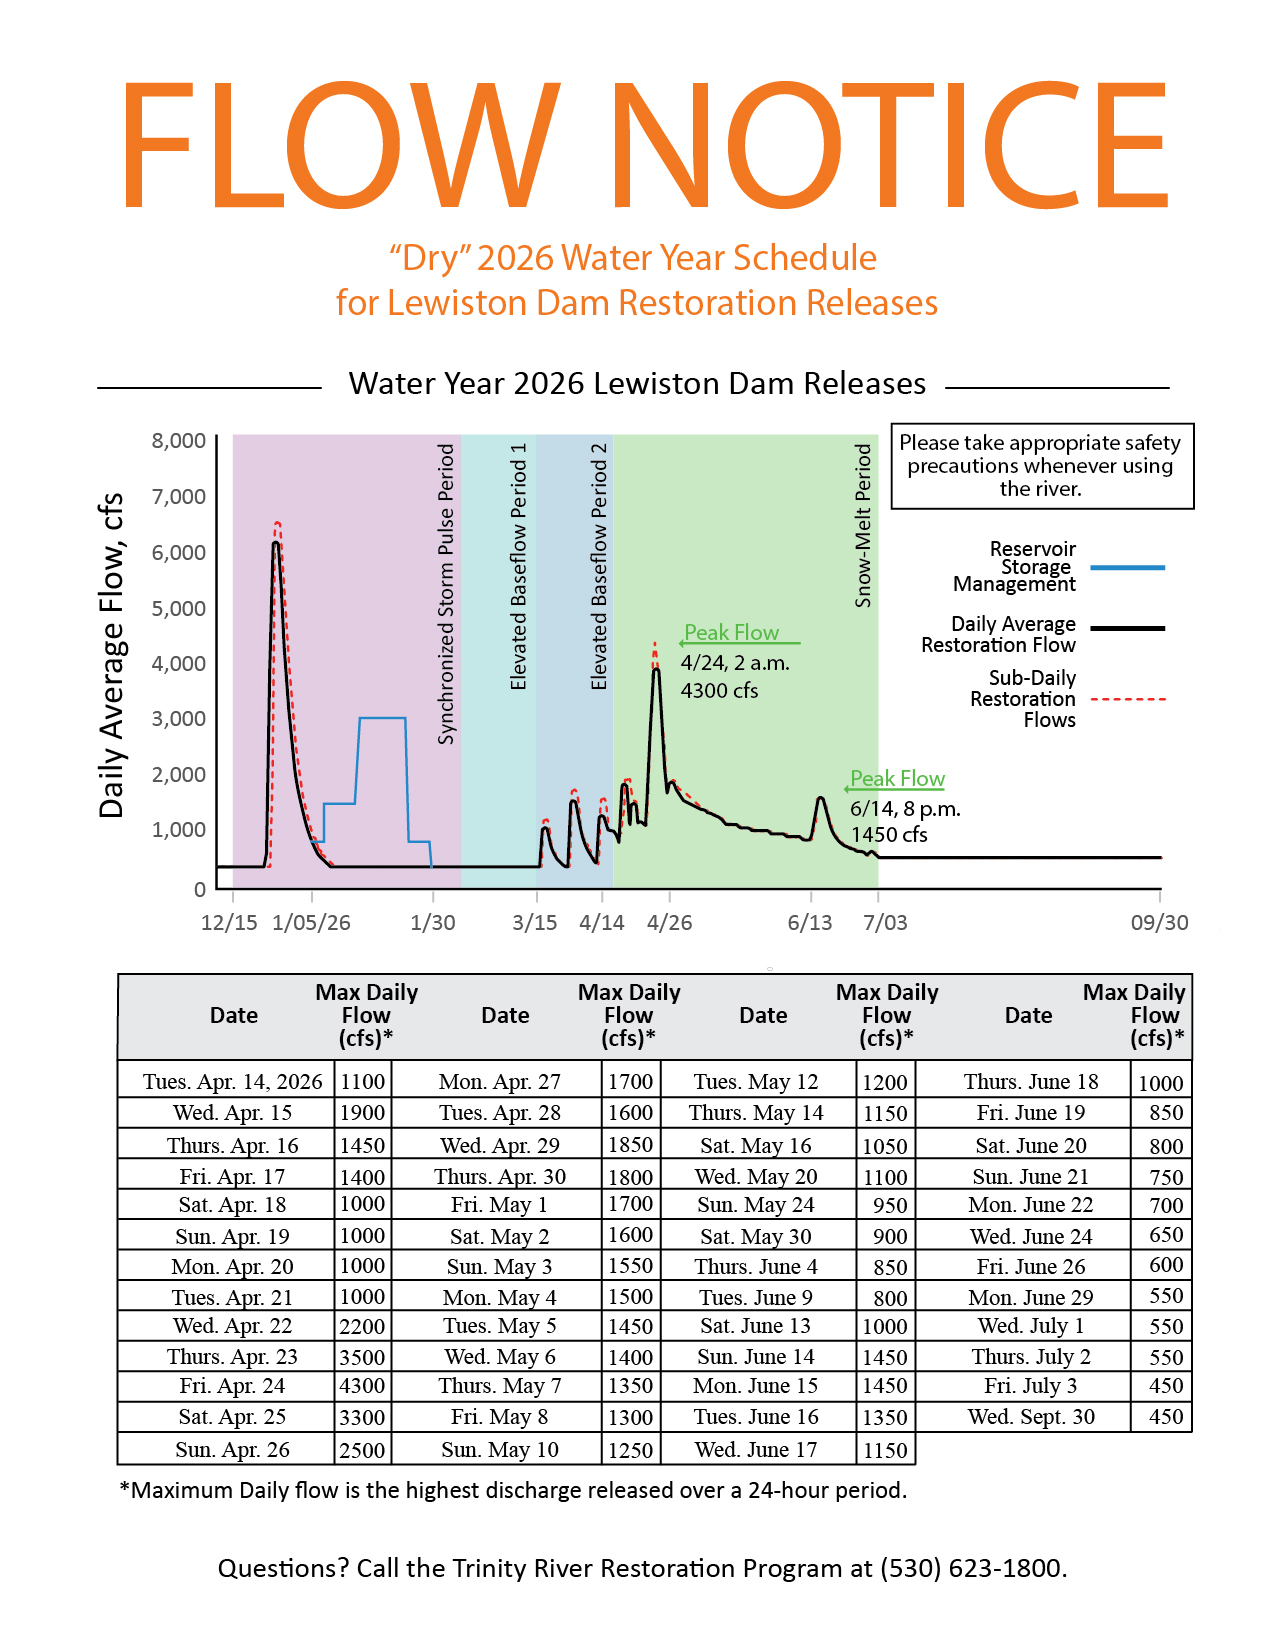
[April 16, 2026] Lewiston, Calif. – The 2026 water year hydrograph has been approved by the U.S. Department of the Interior. Flows will pulse variably from Lewiston Dam staring April 15, 2026. The spring snow-melt peak will reach 4,300 cubic feet per second on Friday, April 24. After the peak, a slow recession declines to 750 cubic feet per second on June 9. Flows are scheduled to pulse up to 1450 cubic feet per second on June 15 then slowly decline to 450 cubic feet per second baseflow by July 3.To stay informed of change order notices for Lewiston Dam please subscribe to the Trinity_Releases google group: http://groups.google.com/group/trinity-releases/boxsubscribe
Environmental Flow Schedule
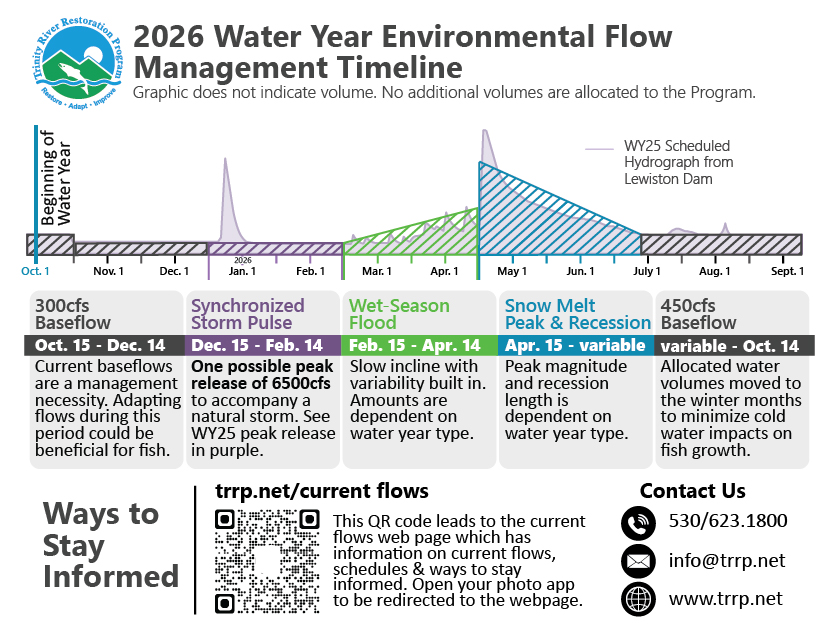
The Program has received approval to continue Environmental Flow releases from Lewiston Dam for Water Year 2026 (under the “Winter Flow Project”). All flows scheduled for release by the Program must match the volume allotted for the water year (see Typical Releases). The U.S. Bureau of Reclamation may release additional water for other purposes.
Realtime Flow Chart
Graph below may take a minute to load.
The red Line indicates the current water year’s schedule, thus far. The red line will update as we receive more information regarding available water.
The blue line indicates flow measurements at the Lewiston gage.
The grey hydrograph an automated estimate of what natural flows past Lewiston Dam would have been without dams.
Block colors indicate flow possibilities for different time periods.
Most data shown here are from the USGS via the waterservices site, plus the USBR and CDWR via the California Data Exchange. Data are provisional and may be recalculated before final approval. The TRRP site checks for new sub-daily values every 15 minutes and for new daily values twice per day. Note that “Full Natural Flow” is an automated estimate from CDWR of the flow that would naturally pass the Trinity Dam site if unimpeded – it is very sensitive to small variations in lake level measurements that may result in negative values when flows would naturally be low, but is more useful for storm events, snowmelt, and averages over longer times. The graphic for water released to the Trinity River versus the water diverted to the Central Valley tends to show higher values for the river until summer, when water exports to the Central Valley typically increase. Click here for a summary of Trinity River flow volumes.
Ways to Stay Informed
This Trinity River flow release notification group is utilized to inform the public about both flow releases and releases to the river for other purposes from Lewiston Dam.
The California Nevada River Forecast Center shows forecasted river levels five days into the future. When a storm is predicted to raise flows to 4500 cfs at the North Fork gauge this initiates a trigger to request a synchronized flow of up to 6500 cfs from Lewiston Dam.
The Trinity River Restoration Program Facebook page is a great place to stay informed of Program activities.
If you have questions, please contact the Trinity River Restoration Program office at 530/623-1800 or by emailing your question to info@trrp.net.